
This memo is thematic. It contains no buy, sell or hold recommendation on any security, and names are discussed only as illustrations of a sector mechanism.
Thematic view.
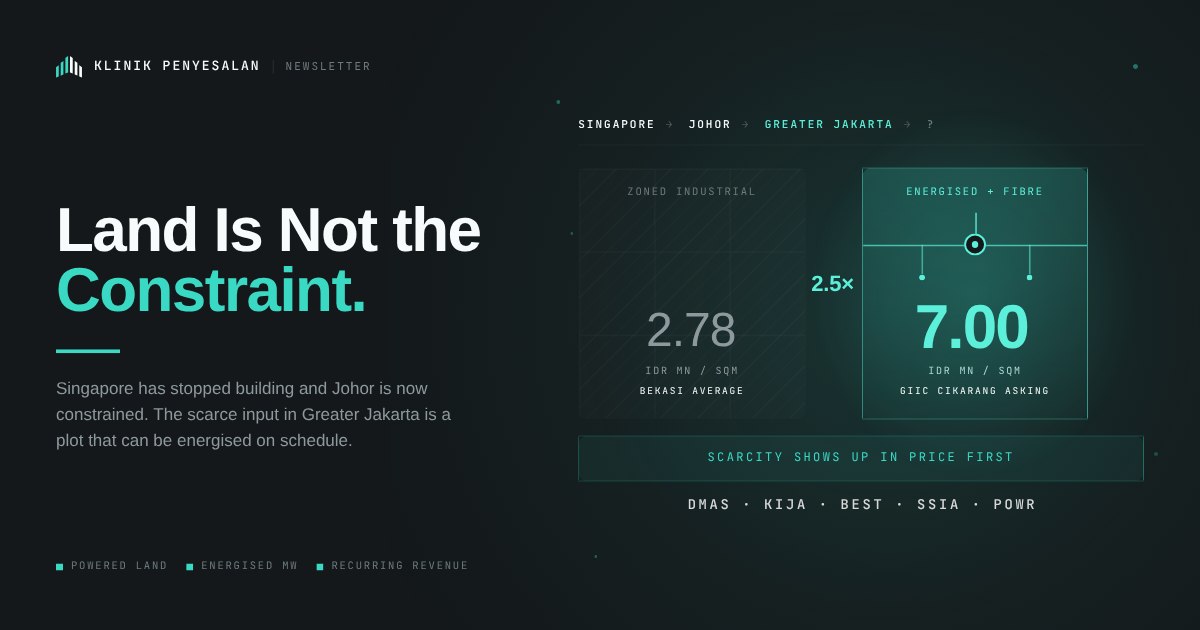
Indonesian industrial estates are being repriced around a variable the sector has never been valued on: deliverable electricity at the plot boundary. Singapore stopped building, Johor ran into water and power limits, and Thailand is now tightening, leaving the Greater Jakarta corridor as the region’s most available large-scale site. But the demand arriving is not land-hungry. A gigawatt of data centre (DC) capacity occupies roughly 30–100 hectares, less than a year of Greater Jakarta absorption, so this cannot be a volume story for estates — it has to be a price-and-annuity story. Land that is energised, fibre-connected and inside a working distribution licence is functionally a different asset from land that is merely zoned industrial, and the two have started to trade apart: a reported DC asking price near Rp7mn/sqm at GIIC Cikarang against a Bekasi industrial average of about Rp2.78mn/sqm. The re-rating case therefore rests on two measurable conversions, not one. Validate with realised ASP per square metre, energised rather than contracted megawatts, and recurring revenue per hectare sold — not announced MoUs.
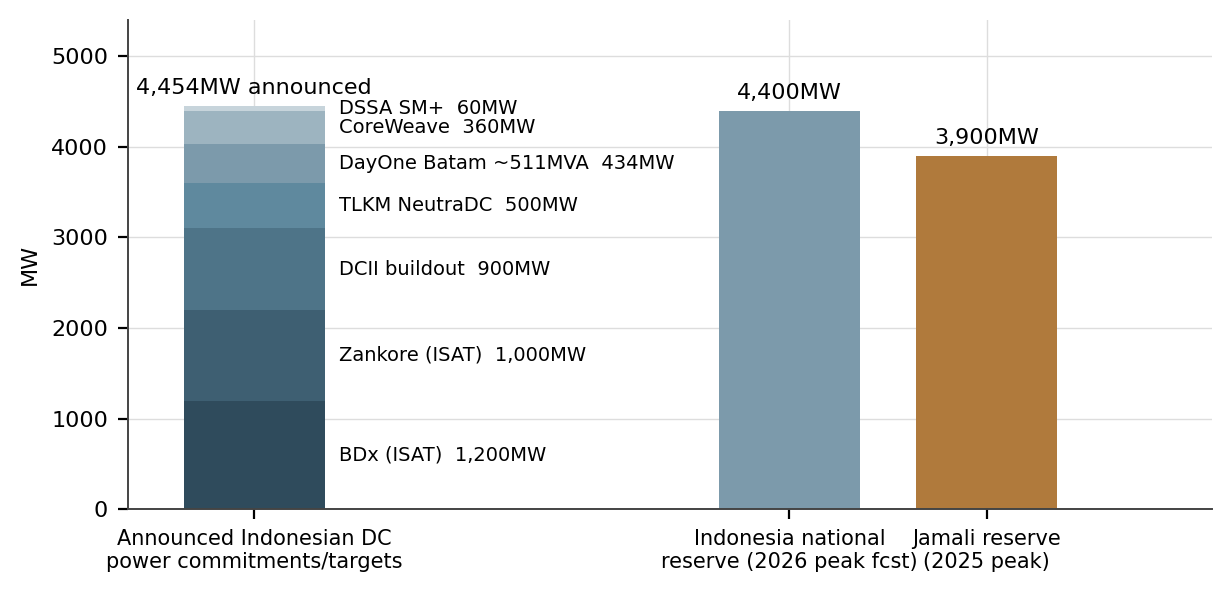
Figure 1 Announced Indonesian DC power commitments vs system reserve margin. Sources: company announcements, PLN, ESDM, UOB Kay Hian; author calculations
The prevailing framing of this theme is a demand narrative: Singapore and Malaysia are constrained, Indonesia is cheaper and emptier, therefore Indonesian estates benefit. That is directionally right but incomplete, because it treats industrial land as the scarce input. It is not. Greater Jakarta holds roughly 14,600–18,500 hectares of industrial supply depending on definition, and absorbed about 312 hectares in all of 2025. The scarce input is a site where hyperscale load can actually be energised on a credible schedule, and that scarcity sits in a handful of nodes along the Bekasi–Cikarang–Karawang corridor. This memo therefore inverts the usual order: it starts from the power system, derives what that implies for land, and only then asks what can re-rate.
1. The spillover is a displacement, not a forecast
The distinguishing feature of this theme is that the demand already exists and is being physically pushed. Singapore’s 2019–22 moratorium acknowledged binding limits on land, power and water, and the Data Centre Call for Application scheme that replaced it reopened capacity only under sustainability conditions. Johor absorbed the displacement, drawing roughly US$35bn of investment and becoming the region’s fastest-growing cluster.
Johor has now hit the same wall. In November 2025 the state asked developers to defer water-cooled expansions for about eighteen months, to roughly mid-2027, and stopped approving the highest water-use categories. Residents protested outside a construction site in Gelang Patah in February 2026, the first such protest in the country. CBRE Indonesia put the regional position bluntly in July 2026: Singapore cannot build, Johor’s electricity and water are limited, and Thailand — previously the alternative — is now also finding power and water hard to secure.
This matters for the quality of the thesis. A demand forecast can be wrong; a displacement is an observable event with a physical cause, and it produces a sequence rather than a level — capacity moves to the nearest jurisdiction that can still deliver power and water, until that jurisdiction also binds. Indonesia is the current position in that sequence, not the end of it. The analytical question is how much capacity Indonesia can physically absorb before it becomes the next Johor, and which estates sit inside that absorbable subset.
2. Deliverability, not generation, is the binding constraint
Indonesia looks well supplied in aggregate and tight at the margin. Installed generation capacity was about 107.5GW in 2025. Against that, ESDM projected 47.2GW of peak load versus 51.6GW of available supply (Daya Mampu Pasok) for the Ramadan–Idulfitri 2026 period, a reserve of only 4.4GW or 9.3%. The Java–Madura–Bali system carried 38.0GW of available supply against 34.1GW of peak load at the 2025 peak, a 3.9GW or 11.3% reserve. Batam is tighter still in absolute terms, with roughly 881MW of net capable supply against 761MW of peak load in March 2026, leaving about 120MW.
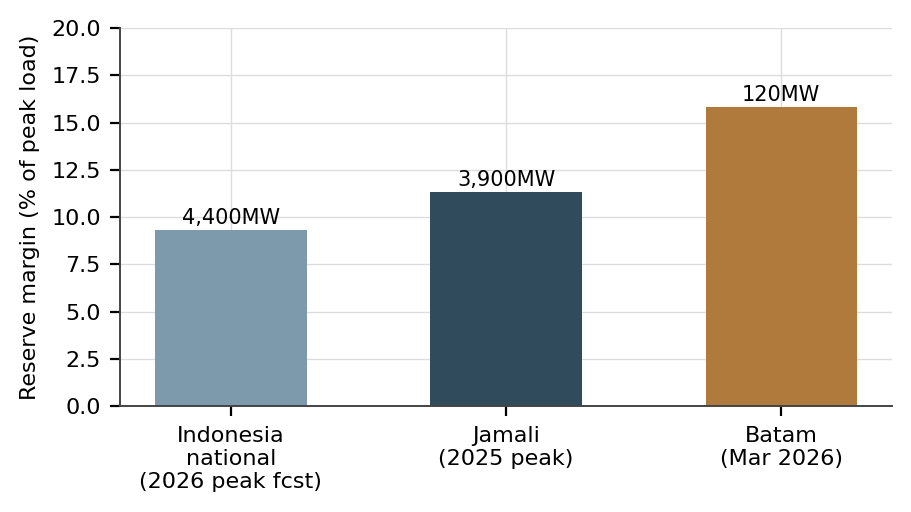
Figure 2 System reserve margins. Source: ESDM, PLN Batam, UOB Kay Hian
Set the announced DC pipeline against those numbers. BDx has secured about 1.2GW of PLN commitments across three Java campuses; ISAT’s Zankore platform targets up to 1GW; DCII’s two hyperscale campuses target more than 900MW at full buildout; NeutraDC targets 500MW by 2030 and signed a further PLN MoU on 11 August 2026 for up to 200MW in Cikarang; PLN Batam signed a 511MVA agreement with DayOne in April 2026, the largest in the country; and on 4 August 2026 CoreWeave announced three Greater Jakarta facilities totalling 360MW of contracted IT power for 2028. Summed on a headline basis that is roughly 4.5GW — approximately the entire national reserve margin.
That comparison is deliberately crude and is not a shortage claim. The announcements sit on non-comparable bases — PLN commitments, buildout targets and contracted IT power are different quantities — they phase out to 2030, coincident load runs well below nameplate, and PLN’s 2025–34 RUPTL targets 69.5GW of additional generation and storage. The narrower point is that at current headroom, DC load is no longer a rounding error against the reserve, so allocation becomes locational and political rather than automatic.
The more precise version of the constraint came from CBRE in July 2026: Java is oversupplied on total generation, but the transmission has to be built. Live DC capacity in the Jakarta area is around 700MW with a 1.2GW pipeline behind it, and operators that have signed MoUs with PLN will need roughly 2GW in the following year. If the constraint were generation, the beneficiary would be whoever owns generation. Because the constraint is delivery to a specific node — substation capacity, 150kV and 20kV distribution, redundancy, and fibre — the beneficiary is whoever already owns the node. That is the analytical hinge of this memo.
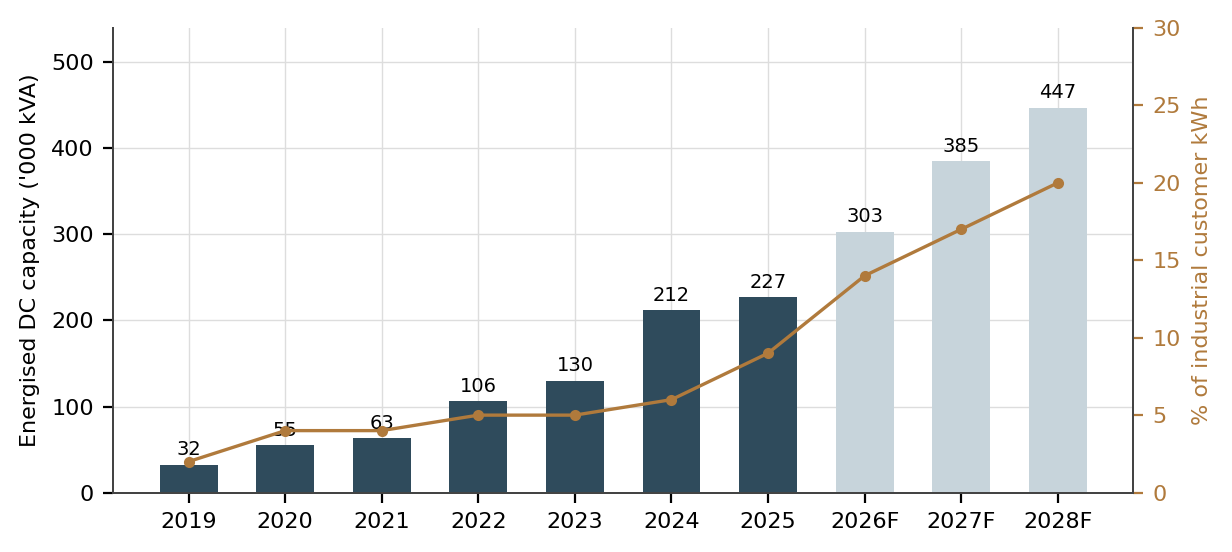
Figure 3 Cikarang Listrindo (POWR) energised DC capacity and share of industrial customer consumption. Source: POWR; 2026F–28F are company projections
Cikarang Listrindo is the cleanest read on that hinge, holding the integrated supply licence for five Cikarang estates including Jababeka and MM2100. Its DC-contracted capacity reached 274MVA as of June 2026, about 12% of industrial customer consumption, and it guides energised DC capacity from roughly 215MW in March 2026 to around 425MW by 2028, against 1.19GW installed at about 67% utilisation. That is the most concrete public measure of how fast the Cikarang node can absorb load.
3. Megawatts into hectares: why this cannot be a volume story
Data centres are extraordinarily land-light relative to their power draw, and Indonesian projects give direct anchors. BDx’s CGK5 at Suryacipta launched as a 100MW campus on a 12-acre (roughly 4.9ha) plot; DCII’s H2 in Karawang sits on about 30ha against a buildout target above 600MW; its multi-storey H1 in Cibitung targets 300MW on about 8.5ha. Those imply roughly 20 to 35MW per hectare, with low-density single-storey campuses lower.
|
Land intensity |
Land per 1GW |
Land for 4.5GW announced |
% of Greater Jakarta supply |
Years of 2025 absorption |
|---|---|---|---|---|
|
10 MW/ha (low density) |
100 ha |
~445 ha |
3.0% |
~1.4 years |
|
20 MW/ha (CGK5, DCII H2) |
50 ha |
~223 ha |
1.5% |
~0.7 years |
|
35 MW/ha (DCII H1, multi-storey) |
29 ha |
~127 ha |
0.9% |
~0.4 years |
Table 1. Land implied by announced DC power, at observed Indonesian land intensities. Greater Jakarta supply taken at 14,607ha (Savills, Q1 2026); 2025 absorption 311.85ha. Author calculations; illustrative, not a forecast.
The conclusion is uncomfortable for the simple version of the theme. Even on the low-density case, the entire announced pipeline consumes about three per cent of Greater Jakarta industrial supply and under eighteen months of normal absorption. CBRE estimates roughly 100ha of east-corridor land was bought by DC operators in 2026 to date, much of it land-banking, with an MoU signed almost weekly. That is a large share of a slow year — Colliers recorded 36.74ha of Q2 absorption and Savills 23.3ha in Q1 — but it is not a structural change in land demand.
If an estate’s story depends on DC hectares sold, the arithmetic caps the upside quickly. The interesting questions are what happens to the price of the few hectares that qualify, and what the estate keeps after the sale.
4. Where the scarcity prices: powered land as a separate asset class
Because the qualifying subset is small and the buyers are capital-rich and schedule-driven, scarcity should show up first in price — and appears to be doing so. Colliers put the national industrial land average near Rp2.749mn/sqm in early 2026, with Bekasi at Rp2.78mn, Tangerang Rp2.76mn, Karawang and Purwakarta Rp2.25mn and Subang Rp1.90mn. Against that, CBRE reported a GIIC Cikarang DC asking price of about Rp7mn/sqm, explicitly because the data centres are concentrated there.
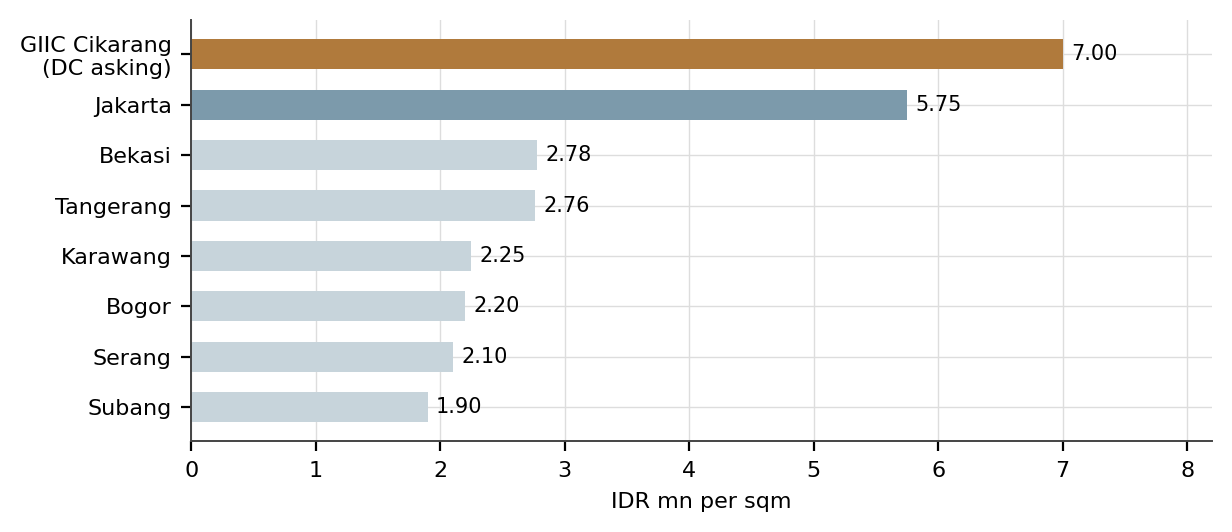
Figure 4 Industrial land pricing by location vs reported DC asking price at GIIC. Sources: Colliers (early 2026), CBRE (July 2026)
Two cautions are essential: Rp7mn/sqm is an asking price from a market briefing rather than a disclosed transaction print, and the spread partly reflects location and existing infrastructure rather than a pure DC premium. The direction is nonetheless corroborated — CBRE reports Cikarang prices rising fastest of any industrial area over three years, and Colliers frames Q2 2026 as power-ready estates commanding premiums while overall investment turns selective and headline pricing stays flat near US$180/sqm.
The mechanism worth naming is that this looks less like a property cycle than a queue for a constrained utility connection, with land as the settlement instrument. Estates are effectively selling an option on grid access. Where a plot carries a credible energisation path, redundancy and fibre, it should price toward the value of the queue position; where it does not, it should keep pricing off manufacturing comparables. That is why the sector should disperse rather than re-rate uniformly: two estates with similar landbanks and similar headline NAVs can hold fundamentally different assets.
The early evidence is exactly that dispersion. DMAS, whose GIIC estate hosts the cluster, sold about 46ha of industrial land in 2025 with DCs contributing roughly 60% of land sales, and reported 1H26 revenue of Rp1.80tn (+193%) with industrial land at 97.2% of revenue and net profit up 175% to Rp1.19tn; marketing sales of Rp1.15tn reached 55% of target against an 85ha pipeline that is more than 70% data centre. SSIA over the same period recorded 9.4ha and Rp195.9bn of industrial marketing sales, with its powered Karawang estate down to roughly 14ha and its 135ha 2026 target concentrated in Subang.
5. The annuity beneath the land
A land sale is a one-off. A data centre tenant, once energised, is a very high-load-factor consumer of electricity, water, wastewater treatment and estate services for decades, and it does not lay off staff in a downturn or relocate to Vietnam over wage differentials. If the theme has a durable earnings consequence, this is where it sits: a shift in revenue quality from lumpy, recognition-driven land sales to annuity utilities.
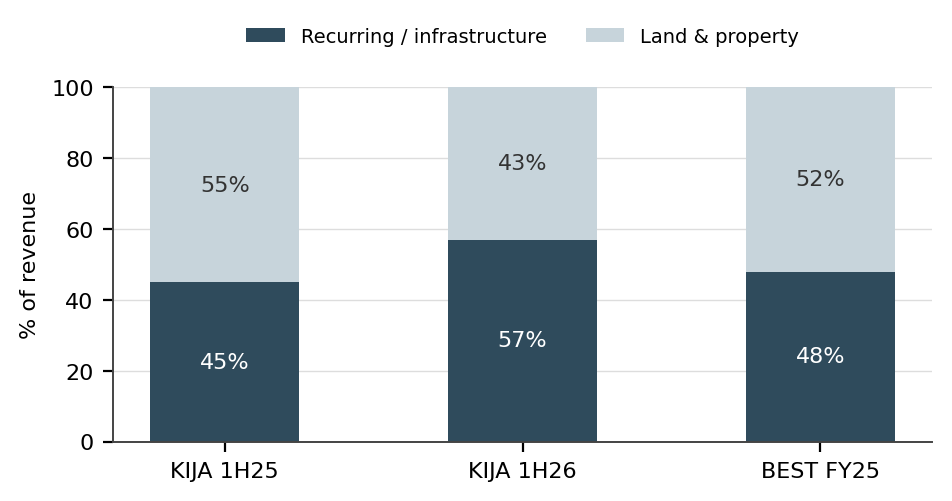
Figure 5 Recurring versus land and property revenue mix. Source: company disclosures (KIJA 1H26 results, BEST FY25)
KIJA is the clearest live case, instructive precisely because the headline was poor. Consolidated revenue fell 11% to Rp2,436.5bn and the company reported a net loss of Rp6.4bn against a Rp627.6bn profit, driven by one-off refinancing costs including a Rp280.7bn FX loss and a Rp154.6bn loss on terminating hedges as USD Senior Notes were refinanced into rupiah bank debt. Underneath that, operating profit stayed positive at Rp524.0bn, infrastructure revenue rose 15% to Rp1,398.2bn, services and maintenance revenue grew 39%, and recurring revenue moved from 45% to 57% of the total. BEST shows the same structure at smaller scale: Rp207bn of Rp427bn FY25 revenue, roughly 48%, was recurring.
The critical qualification is that the estate does not automatically capture the electricity annuity. In Cikarang, POWR holds the integrated supply licence across five estates including Jababeka and MM2100, which is why POWR is the cleanest DC read-through and why estate-level capture concentrates in water, wastewater and estate services. KIJA’s Bekasi Power is often described as captive generation, but its 130MW combined-cycle plant sells 100% of output to PLN under a twenty-year offtake signed in February 2011 (118.8MW contracted), with the company buying back from PLN to resell to factories at a margin. That is a distribution and reseller economic, not an islanded private grid, and in 1H26 its gross margin fell to 2% from 22%, which management attributes to temporary operational factors. The label should be tested, not accepted.
|
Estate (ticker) |
Position against the power gate |
Evidence in 2025–26 |
Key questioning point |
|---|---|---|---|
|
Puradelta Lestari (DMAS) |
Tightest fit. GIIC is where the Cikarang DC cluster has physically formed; premium supply, redundant fibre, looped clean water. |
DCs ~60% of 2025 land sales; 1H26 revenue Rp1.80tn (+193%), net profit Rp1.19tn (+175%); pipeline 85ha with >70% DC; industrial landbank below 150ha as of 31 Mar 26; converting commercial and residential land to industrial, targeted mid–late 2027. |
Does scarcity get monetised as price, or does the landbank simply run out first? Watch realised ASP per sqm and the conversion timetable. |
|
Kawasan Industri Jababeka (KIJA) |
Only listed estate with generation inside the estate, plus its own water, wastewater and dry port; served by POWR for wider cluster supply. |
Recurring revenue 57% of 1H26 total, up from 45%; 2H26 land pipeline of ~140ha (40ha Cikarang including DC demand, 100ha Kendal); ~500ha Jababeka Digital Park announced with China Silk Road Group. |
Bekasi Power sells 100% of output to PLN under a PPA dated Feb 2011; 1H26 power gross margin fell to 2%. Does “captive power” convert into economics KIJA actually retains? |
|
Bekasi Fajar (BEST) |
MM2100 sits inside the same POWR supply area and is developing a dedicated DC cluster. |
FY25 marketing sales 15ha for Rp422bn; recurring income Rp207bn of Rp427bn revenue; 2H26 pipeline ~75ha with DC named first; FY26 marketing sales target Rp600bn. |
Does DC interest convert into signed land at a repriced ASP, or does the estate keep clearing at legacy manufacturing pricing to hit volume targets? |
|
Surya Semesta Internusa (SSIA) |
Split position: the powered node (Suryacipta Karawang, host to BDx CGK5) is nearly sold out; the landbank (Subang, 2,717ha) is not yet a DC node. |
1H26 recognised 64.7ha for Rp1.08tn but marketing sales of only 9.4ha for Rp195.9bn; ~14ha left in Karawang; 2026 target of 135ha is 121ha Subang. |
Can Subang be energised and fibred quickly enough to inherit DC demand, or does SSIA revert to a manufacturing-land and construction story? |
Table 2. Estate positioning against the power gate. Compiled from company disclosures and press reporting; descriptive only and not a recommendation.
6. Risks and falsification tests
Each risk below has a monitorable signal that would materially weaken the thesis rather than merely delay it.
Commitment does not become energisation. PLN commitments, MoUs and land banking are cheap; substations are not. Falsification test: POWR’s energised DC capacity fails to progress toward its 2028 path for two consecutive reporting periods while announced MoUs keep growing.
Transmission slips. Java is oversupplied on generation and short on delivery. Falsification test: RUPTL transmission tranches slip and announced projects publicly relocate to Batam, Bintan or outside Indonesia.
The rent leaks to the utility. Estates sell land once while the power company keeps the load. Falsification test: recurring revenue per hectare of land sold does not rise at the estates as DC tenants energise, while POWR’s DC share of industrial consumption continues climbing.
Asking prices do not clear. Rp7mn/sqm is an asking price in a thin market. Falsification test: realised ASP per sqm at the DC-exposed estates fails to widen against the Bekasi average through FY26–27.
The coal-grid constraint binds on demand. Java’s grid is coal-heavy, which is a non-tariff obstacle for hyperscalers with Net Zero mandates absent renewable certificates or green PPAs. Falsification test: announced Indonesian capacity skews increasingly to domestic and Chinese operators while Western hyperscalers keep committing elsewhere.
Indonesia has its own Johor moment. The displacement chain ends wherever water and community politics bind first. Falsification test: a Bekasi, Karawang or Batam authority imposes water screening or approval limits on DC projects.
Multiples compress even as volumes grow. The global tower sector re-rated down through the 5G cycle despite strong EBITDA margins, and leading global DC operators already trade near 25x EV/EBITDA. Falsification test: sector multiples compress while absorption and recurring revenue continue to rise.
Interpretation. A weak quarter of land sales does not falsify this thesis; recognition is lumpy and timing-driven, as KIJA and SSIA both showed in 1H26. What matters is whether the powered subset is repricing and whether recurring revenue is compounding underneath it. A quarter in which volumes fall but ASP and recurring revenue rise is consistent with the thesis, not against it.
7. Conclusion and monitoring framework
The Indonesian industrial estate sector is the physical settlement layer for a regional displacement of DC capacity that is already underway. But land is abundant and the pipeline, even at full announcement value, consumes a small fraction of it. The scarce asset is a plot that can be energised on a credible schedule inside an existing distribution and fibre footprint — a subset that is small, concentrated in the Bekasi–Cikarang–Karawang corridor, and demonstrably repricing.
The durable earnings consequence is therefore not the land sale but the annuity beneath it — water, wastewater, estate services and, where the estate holds the licence, electricity. That is why the theme should disperse the sector rather than lift it uniformly, and why estate-level analysis has to start from what an estate actually owns at the node, not how many hectares sit on its balance sheet.
The practical monitoring set follows directly:
- Realised ASP per square metre by estate, tracked against the Colliers and CBRE location benchmarks — the cleanest test of whether powered land is genuinely a separate asset class.
- Energised versus contracted megawatts, with POWR’s DC-contracted capacity and share of industrial consumption as the highest-frequency public proxy for the Cikarang node.
- Recurring revenue share and recurring revenue per hectare of land sold, which separates an annuity build from a one-off land cycle.
- Pipeline conversion rates, measured as hectares transacted against the disclosed pipelines (DMAS 85ha, KIJA 140ha, BEST 75ha), and the DC share within them.
- PLN commitment-to-energisation conversion and RUPTL transmission progress, particularly substation capacity in the eastern Jakarta corridor.
- Green power procurement — renewable certificates, green PPAs and behind-the-meter renewables — as the test of whether Western hyperscaler demand is reachable.
- Landbank replenishment, especially DMAS’s commercial-to-industrial conversion timetable, since scarcity that ends in exhaustion is not a re-rating.
These indicators test whether the physical constraint is being relieved and whether estates capture the value of relieving it. On the evidence to date the mechanism is real and visible in the numbers; what remains unproven is the durability of capture — and that is measurable rather than a matter of opinion.
Selected sources and evidence limits
[1] UOB Kay Hian, “Strategy — Indonesia DCs Capturing The Regional Spillover,” 14 August 2026: system reserve margins, RUPTL targets, DC player capacities, POWR contracted capacity, towerco de-rating precedent. Broker projections are treated as inputs, not verified forecasts.
[2] PT Kawasan Industri Jababeka Tbk, Investor Presentation (August 2026, with 1H26 financials) and 1H26 press release, 31 July 2026: all KIJA financial, marketing sales, Bekasi Power and infrastructure figures.
[3] ESDM and PLN system data as reported in [1]: 2025 installed capacity, Jamali and national Daya Mampu Pasok, PLN Batam March 2026 supply and peak load.
[4] CBRE Indonesia, Property Market Outlook Q2 2026 briefing, 23 July 2026, via IDNFinancials: east-corridor DC land purchases, weekly MoU cadence, Jakarta live DC capacity and pipeline, the GIIC asking price, and the transmission constraint.
[5] Colliers Indonesia (Q2 2026 report and January 2026 pricing data) and Savills Greater Jakarta Q1 2026 via Real Estate Asia. Note that the two report materially different supply totals (18,500ha vs 14,607ha) on differing estate definitions; Table 1 uses the more conservative figure.
[6] Company disclosures and Indonesian press reporting for DMAS, BEST and SSIA marketing sales, pipelines, landbank and 1H26 results (Bisnis, Kontan, IDNFinancials, Antara, June–August 2026).
[7] CoreWeave, 4 August 2026 (three Greater Jakarta facilities, 360MW contracted IT power, targeted 2028); PLN, 27 April 2026 (511MVA agreement with DayOne, Batam — converted here to an approximate MW figure at an assumed 0.85 power factor); NeutraDC–PLN MoU, 11 August 2026 (Cikarang expansion up to 200MW).
[8] Johor and Malaysia constraint reporting: SCMP (November 2025) on the eighteen-month water-cooling deferral, w.media on the Tier 1 and Tier 2 approval halt, The Diplomat (April 2026) on the Gelang Patah protest, Reuters (July 2026) on the US$35bn Johor figure.
[9] Land intensity anchors: BDx CGK5 (100MW on a 12-acre plot), DCII H1 Cibitung (300MW target on ~8.5ha) and DCII H2 Karawang (600MW+ target on ~30ha). These are stated buildout targets, not delivered capacity, so the MW-per-hectare ratios in Table 1 are planning parameters rather than measured densities.
A general limit applies throughout: PLN power commitments, company buildout targets and contracted IT power are different quantities on different timelines, so summing them (as in Figure 1) produces an upper bound on intent rather than a forecast of load. Every approximation, conversion and author calculation is identified at the point of use.
Appendix.
Exhibit 1. Arithmetic underlying Table 1 and Figure 1.
|
Input |
Value |
Source / basis |
|---|---|---|
|
Announced DC power (headline sum) |
4,454MW |
BDx 1,200 + Zankore 1,000 + DCII 900 + TLKM 500 + DayOne ~434 + CoreWeave 360 + DSSA 60 |
|
National reserve, 2026 peak fcst |
4,400MW (9.3%) |
51.6GW DMP less 47.2GW forecast peak load (ESDM) |
|
Jamali reserve, 2025 peak |
3,900MW (11.3%) |
38.0GW DMP less 34.1GW peak load; Batam ~120MW (~881MW less ~761MW) |
|
Greater Jakarta supply / 2025 absorption |
14,607ha / 311.85ha |
Savills Q1 2026 (Colliers reports 18,500ha on a wider definition); 2020–23 average absorption 213ha |
|
Observed land intensity range |
20–35 MW/ha |
CGK5, DCII H2 and DCII H1 buildout targets; 10 MW/ha added as a low-density case |